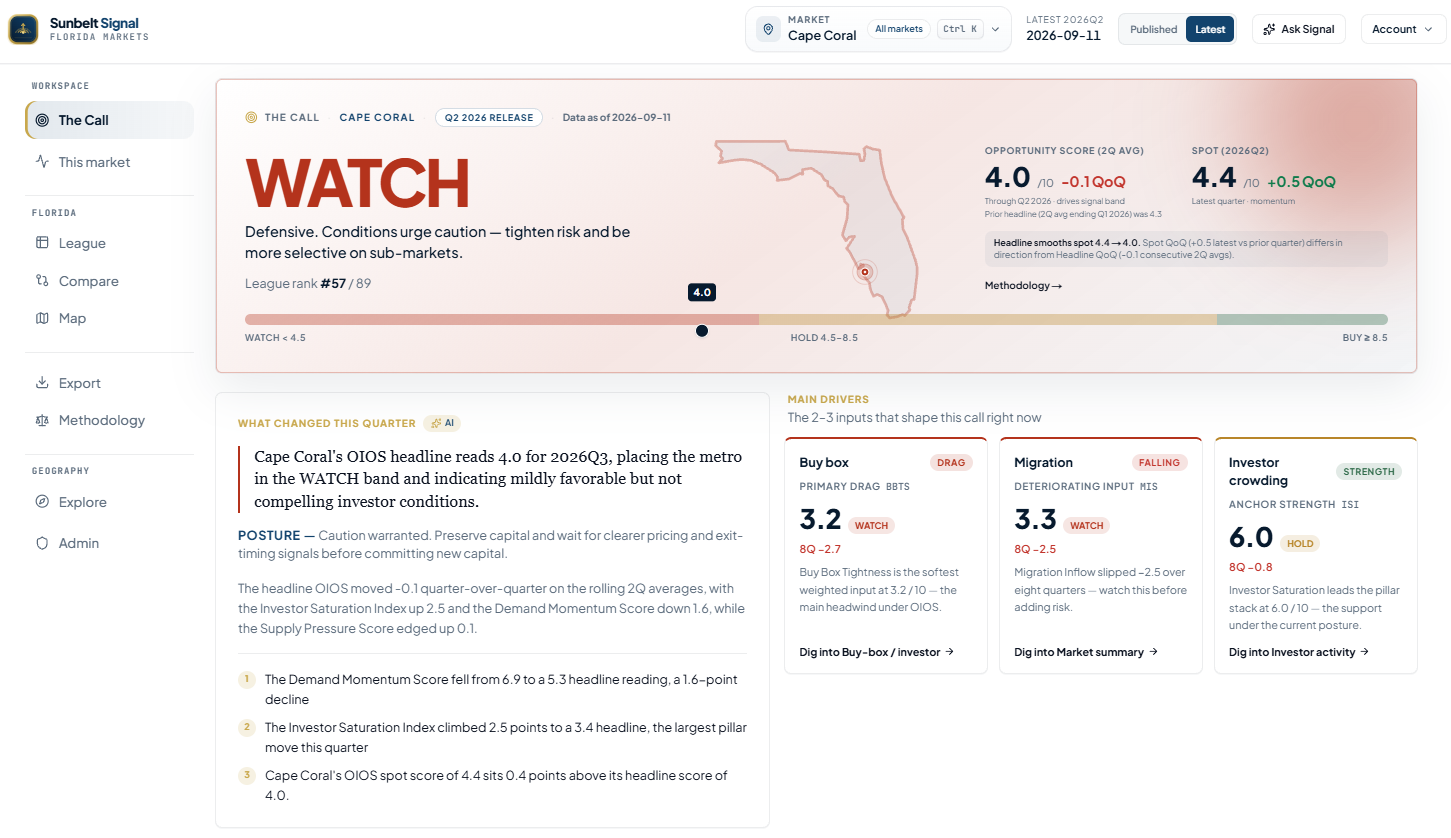
Live subscriber dashboard
The dashboard.
Published numbers match the quarterly investor pack.
Toggle to the latest live data, updated throughout the month.
Live subscriber dashboard
Published numbers match the quarterly investor pack.
Toggle to the latest live data, updated throughout the month.
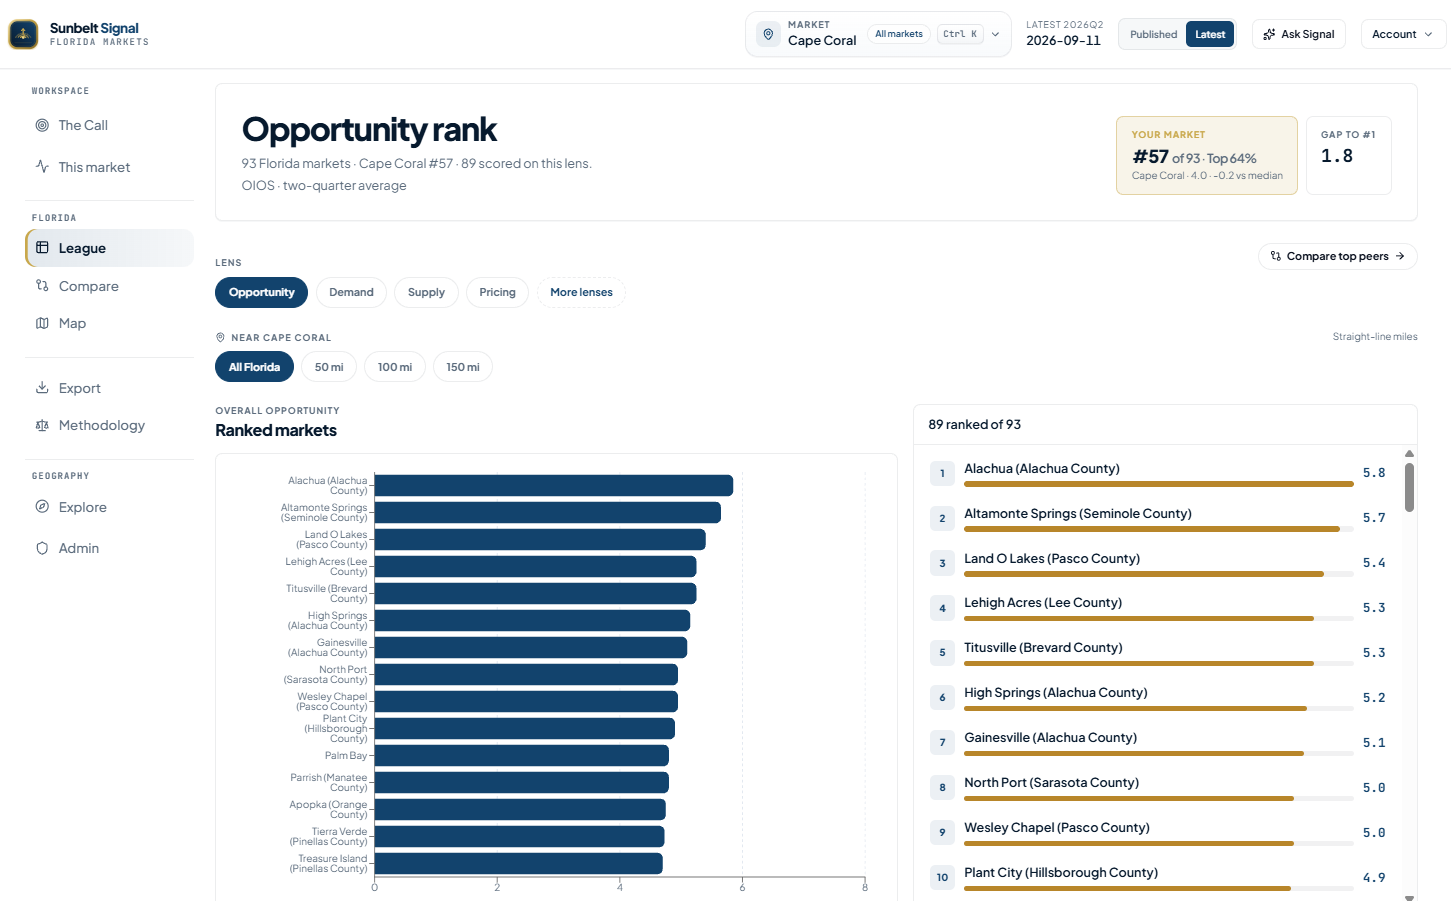
Where capital should go next — opportunity, demand, supply, price. Portfolio adds side-by-side comparison.
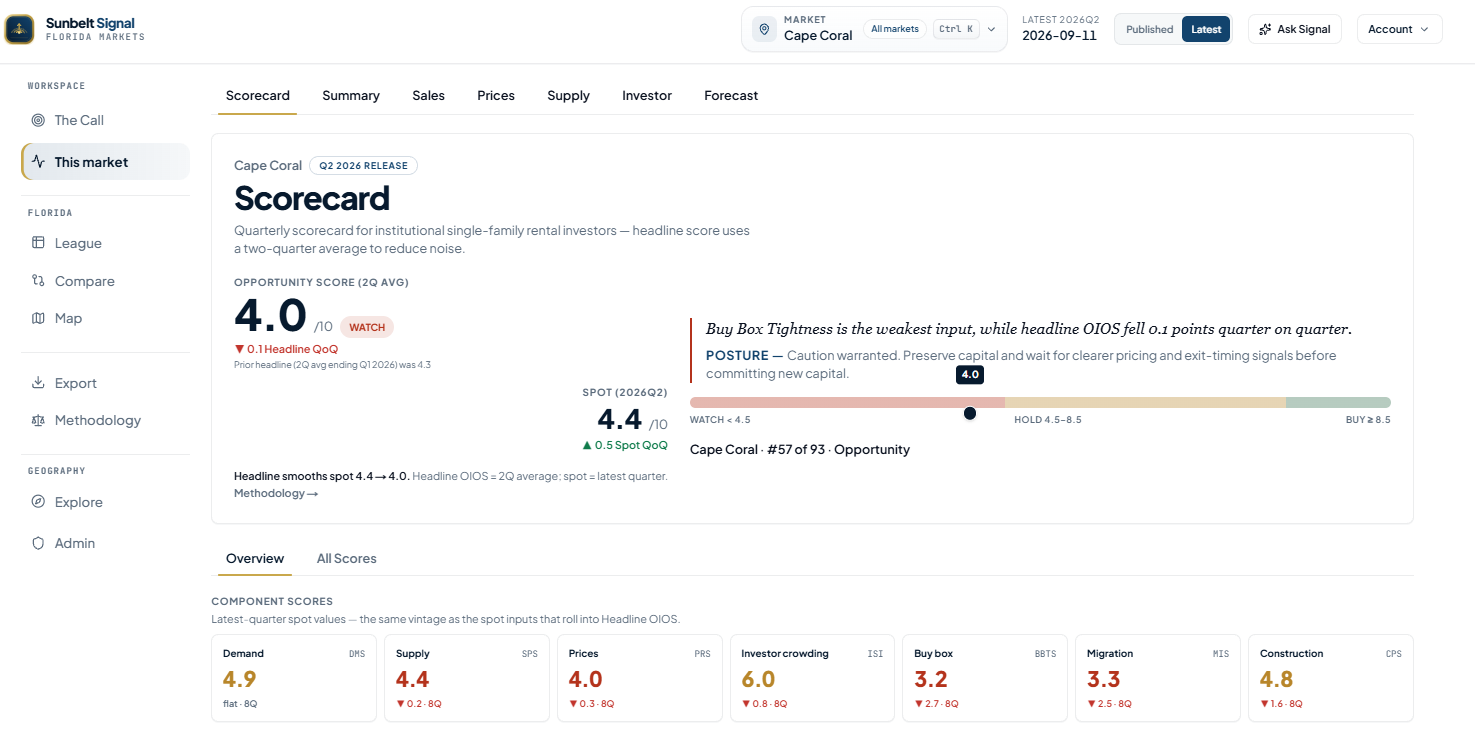
Headline OIOS, seven parts, and the posture for this quarter.
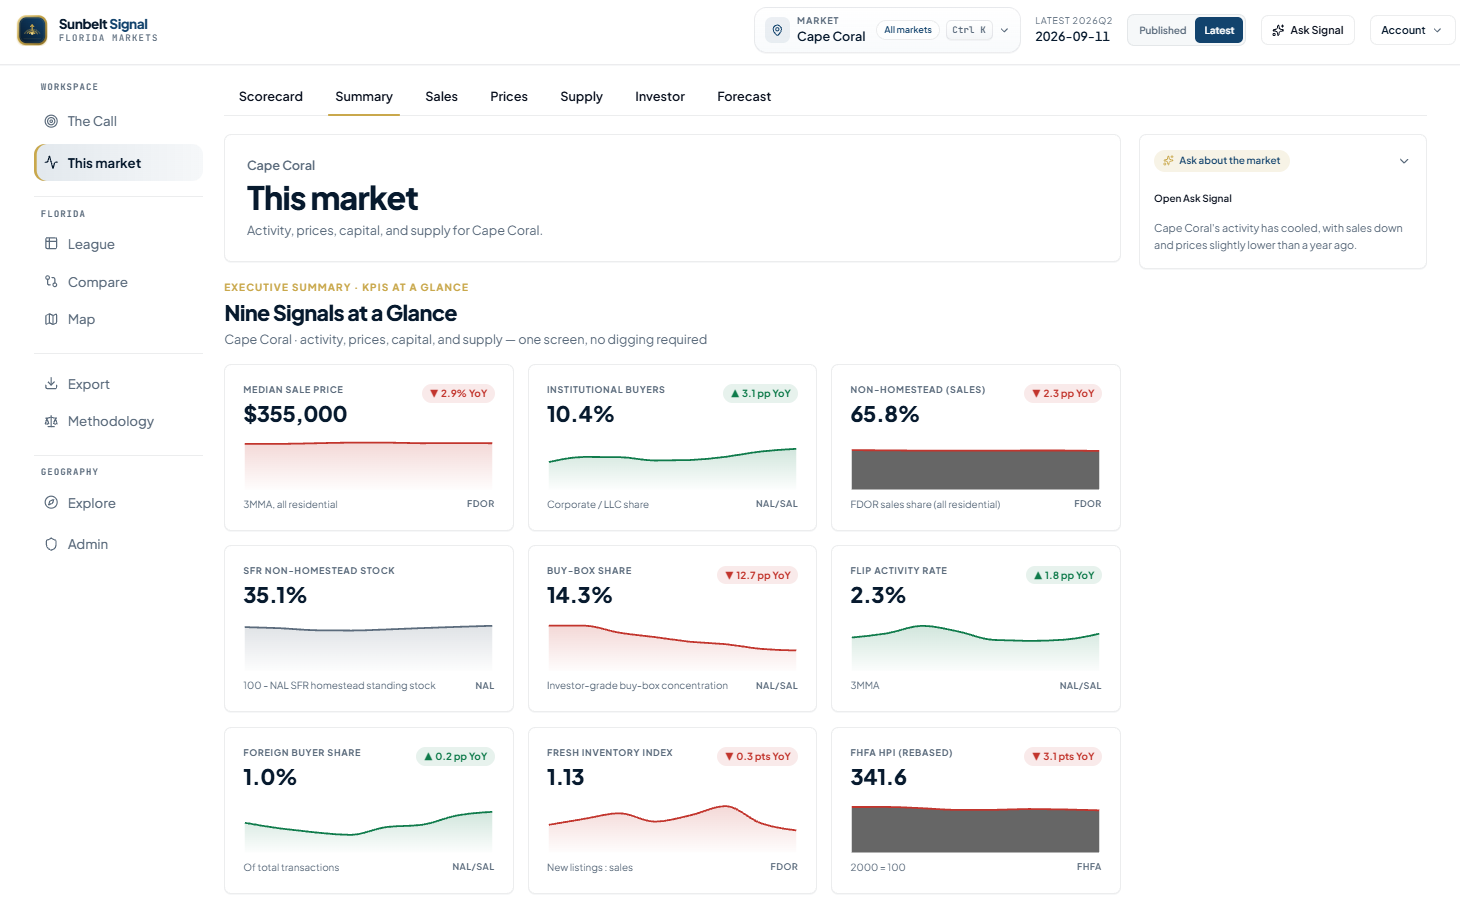
Questions in plain English against the published or latest slice. Answers come from the data you have selected.

Nine signals on one screen — activity, prices, capital, supply.
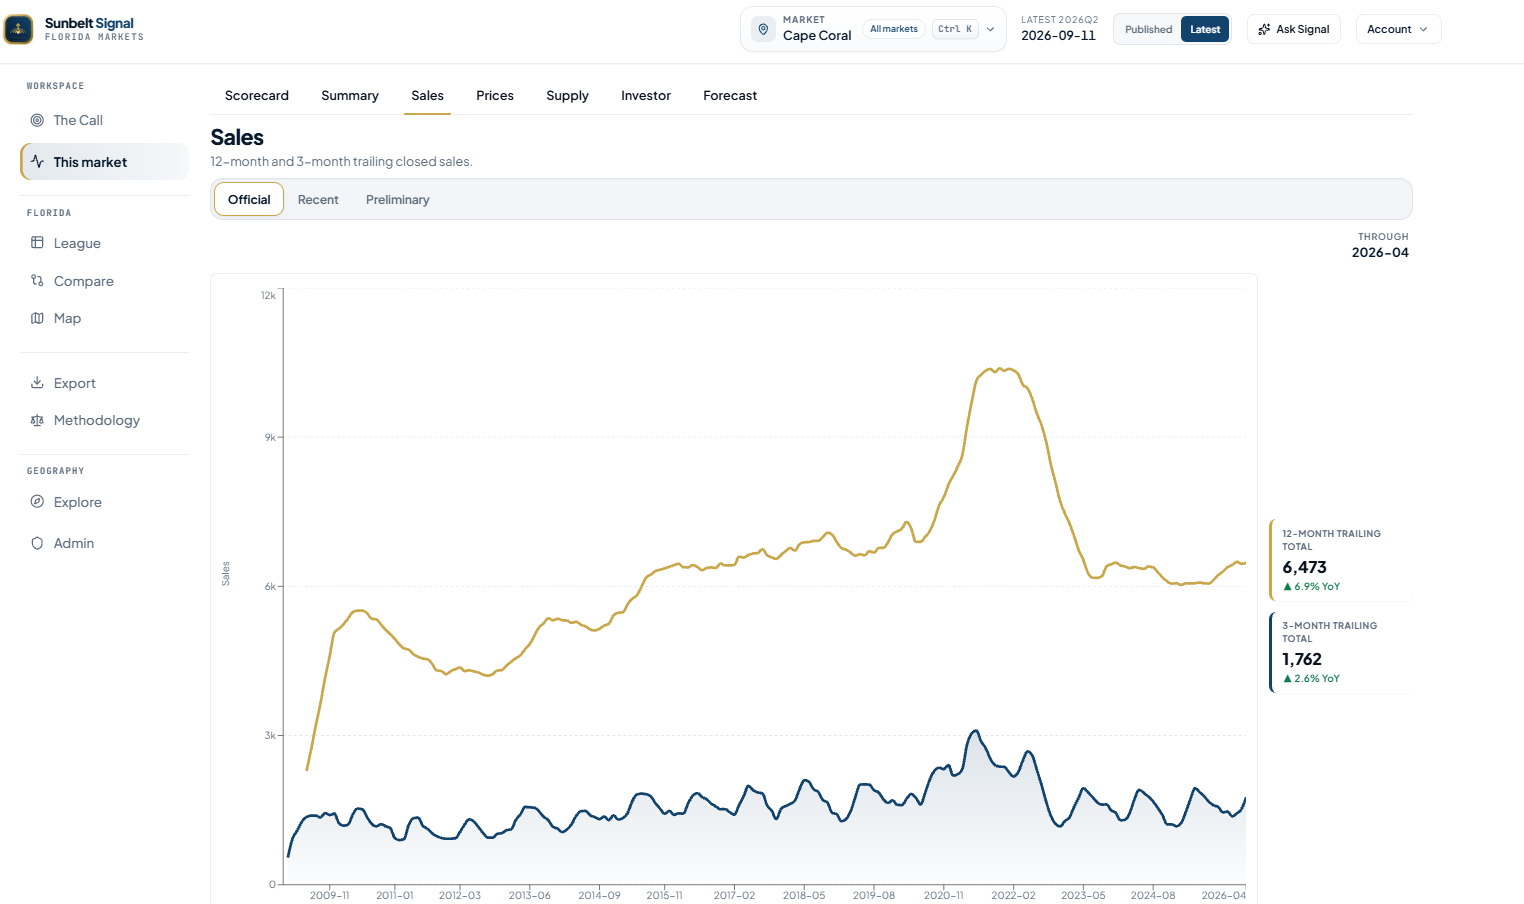
Official recorded sales, not listing asking prices.
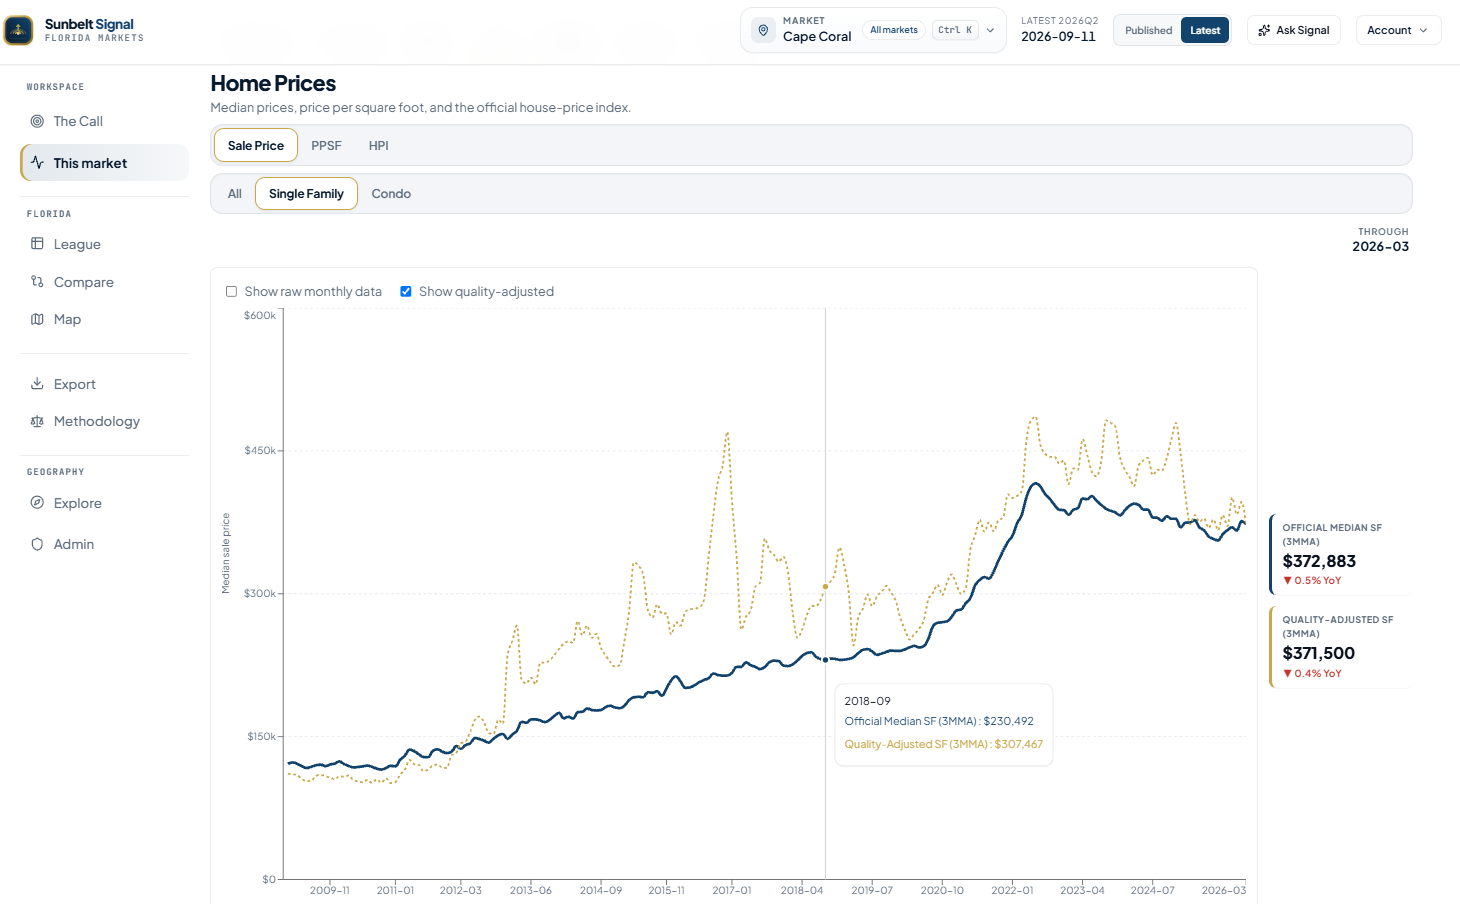
Median single-family, official and quality-adjusted.
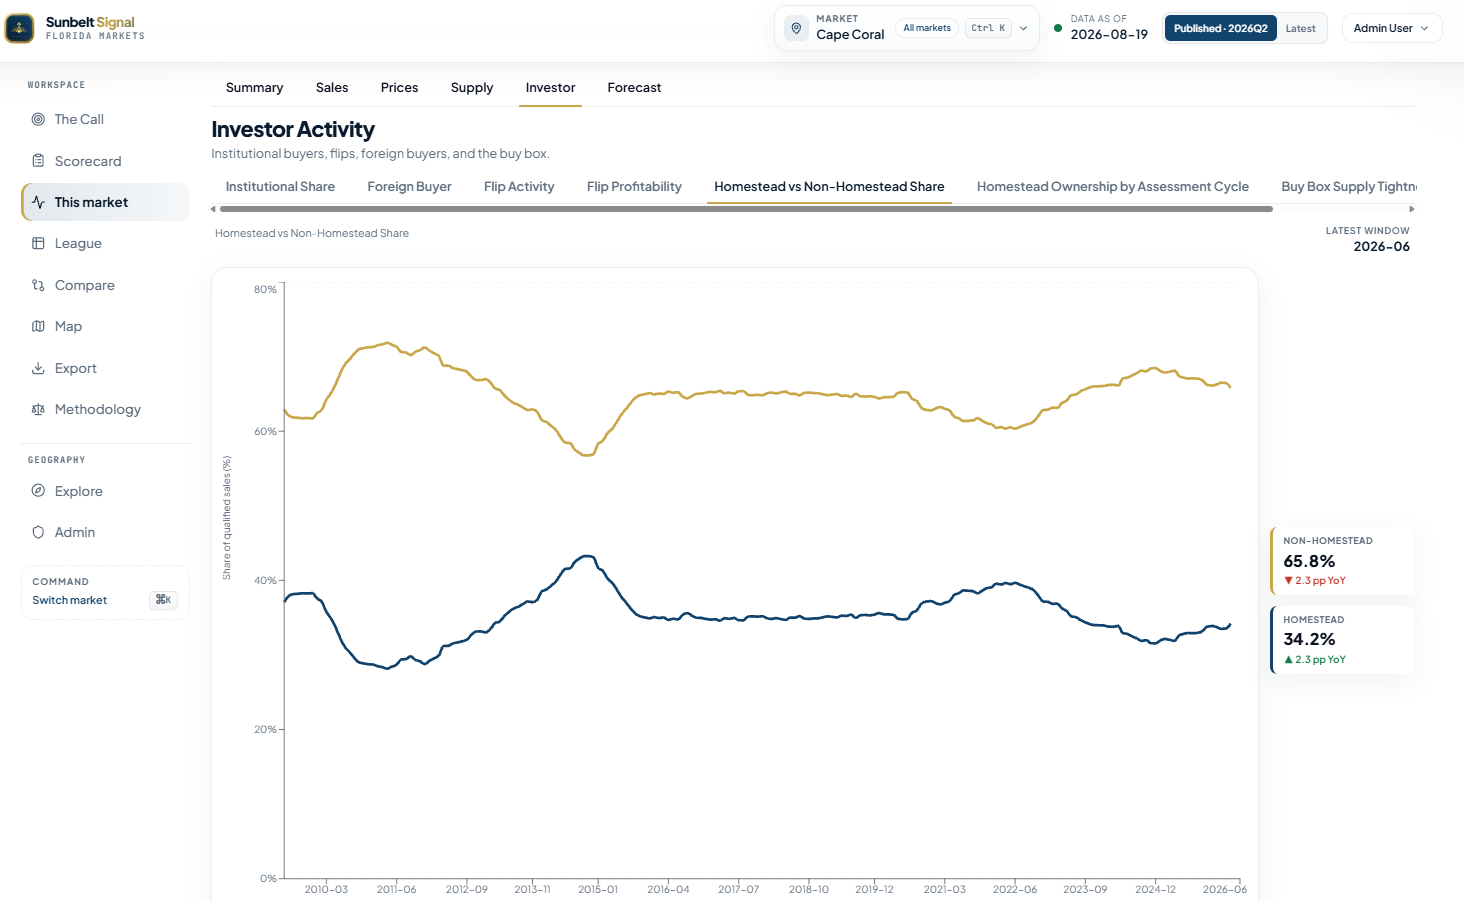
Homestead vs investor share from the county rolls.
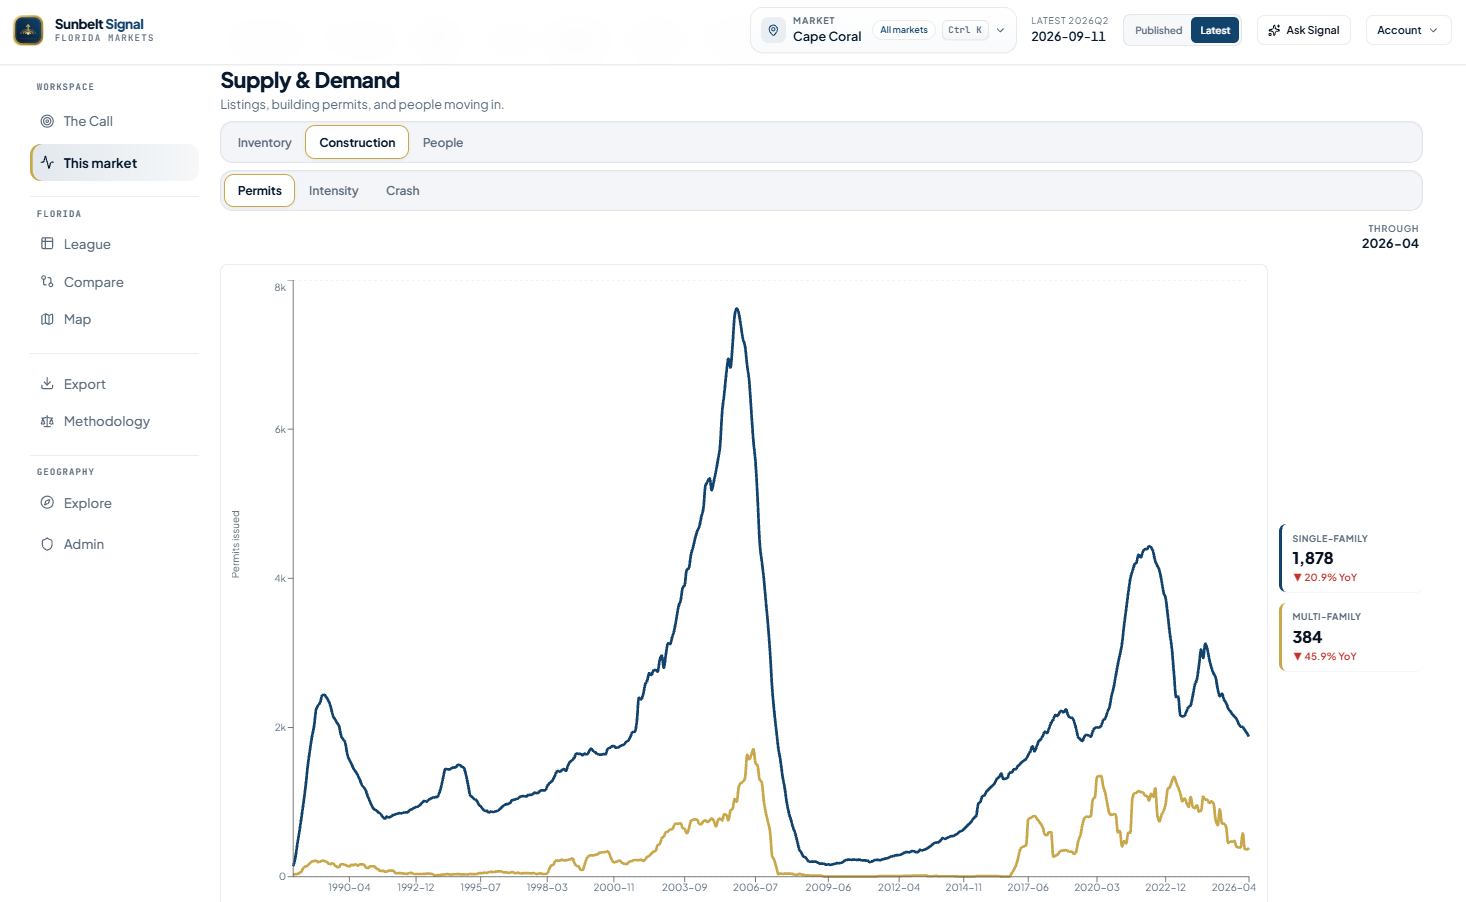
The construction pipeline, before it shows up in sales.
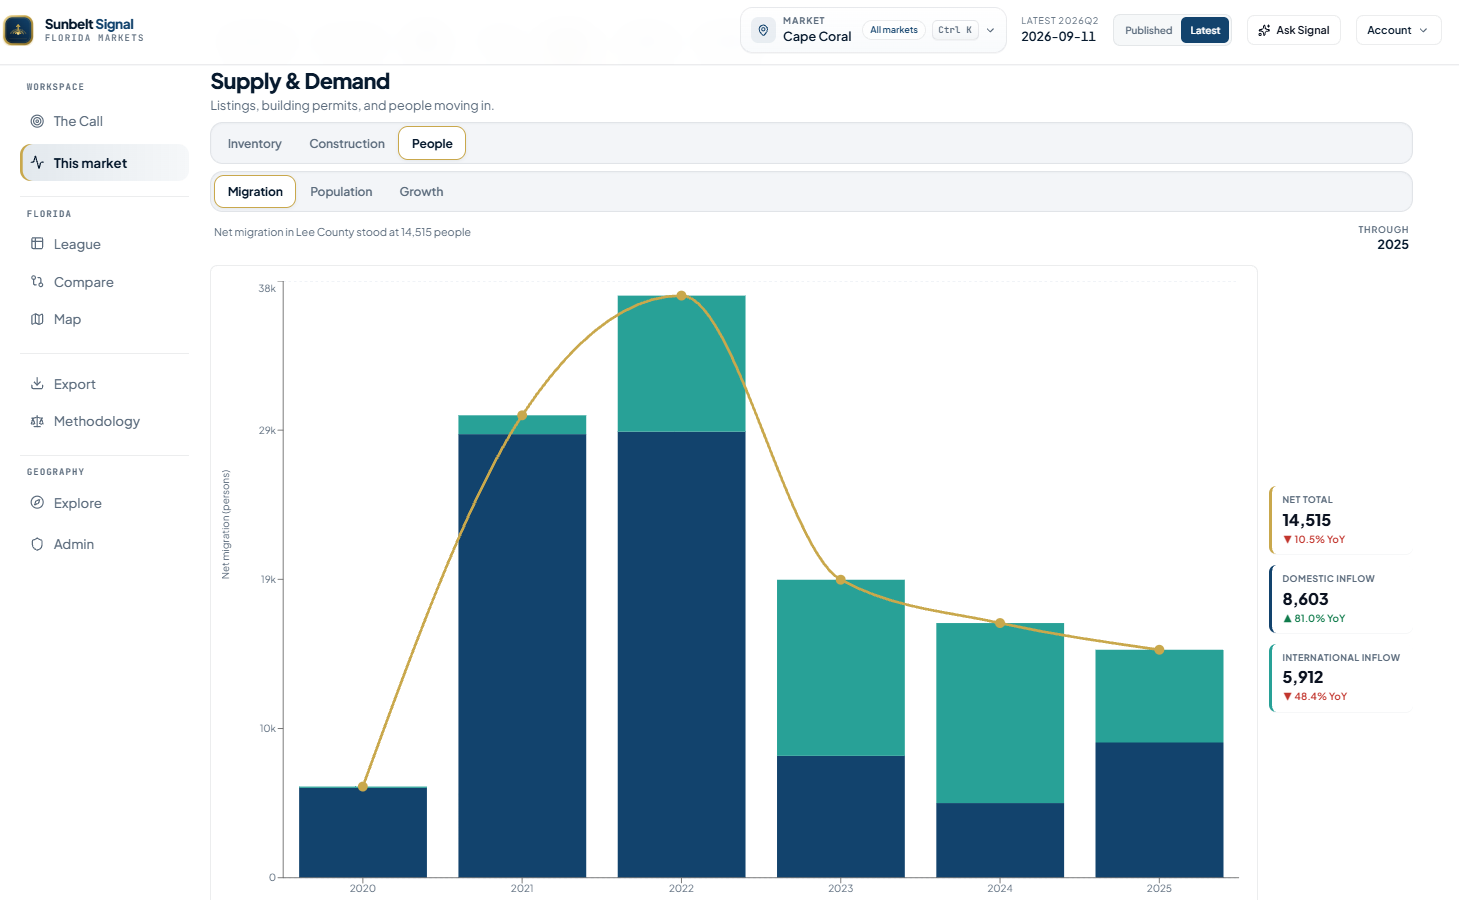
People moving in — domestic and international.
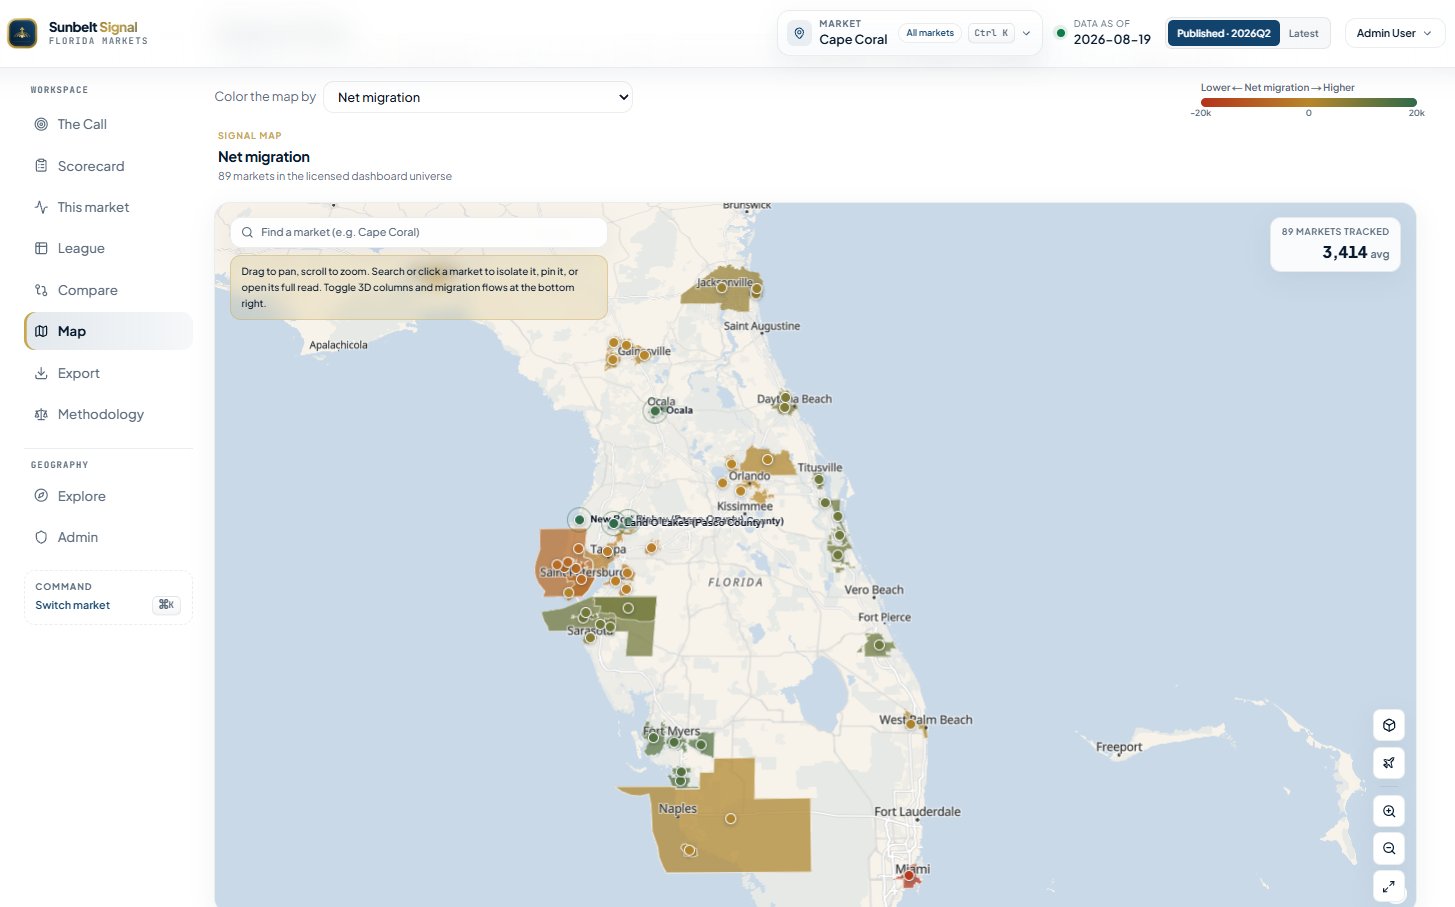
89 markets, coloured by the signal you choose.
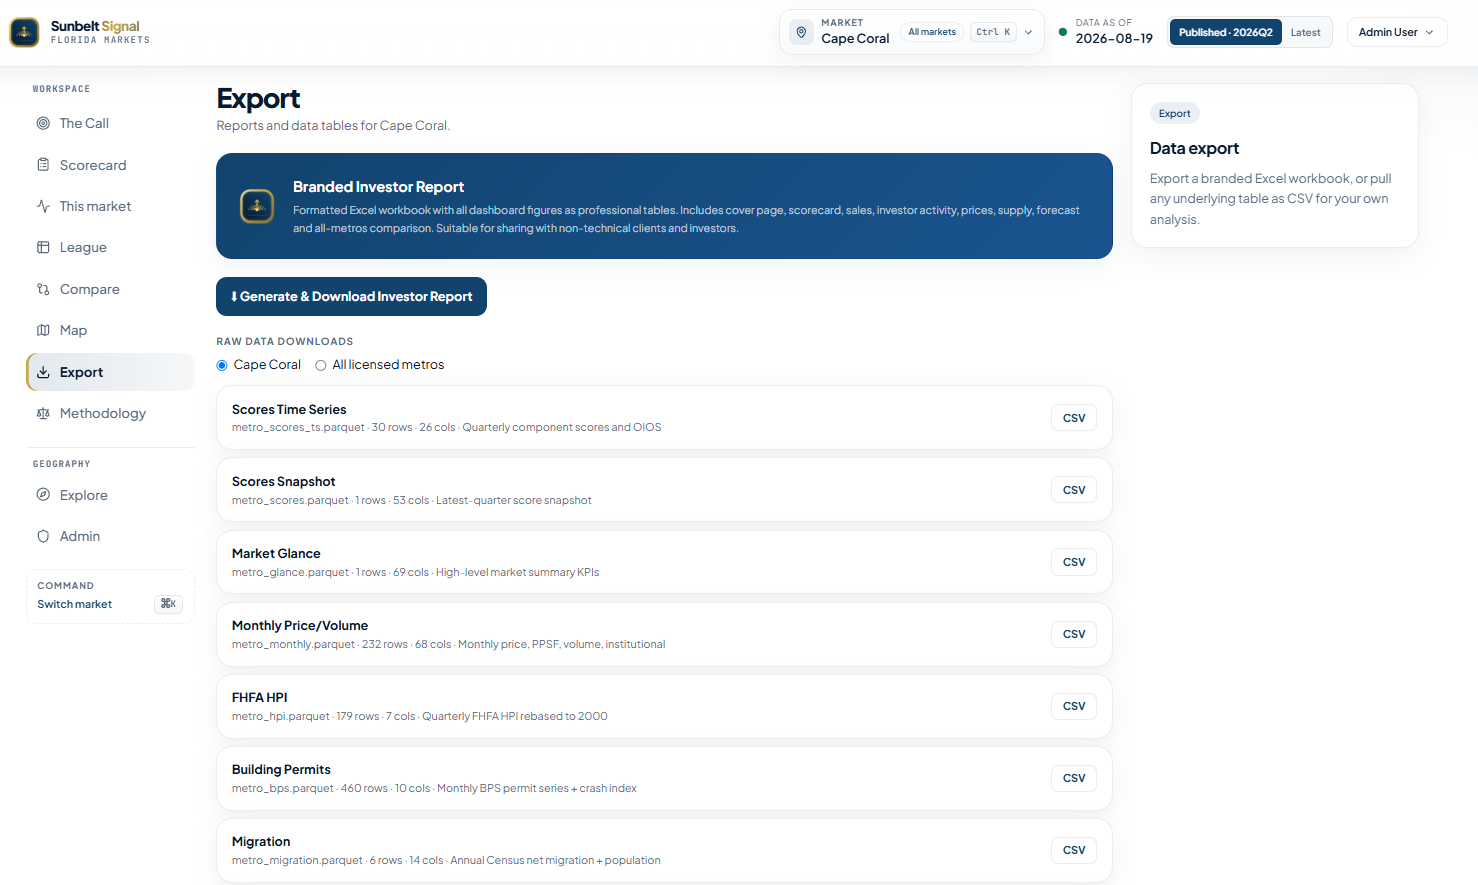
Branded report, or CSV for Excel, Python, or R.
Founding access · Q4 2026
Request a complimentary Cape Coral sample, or reserve founding access and lock today’s rate. Preview the live dashboard when you are ready.